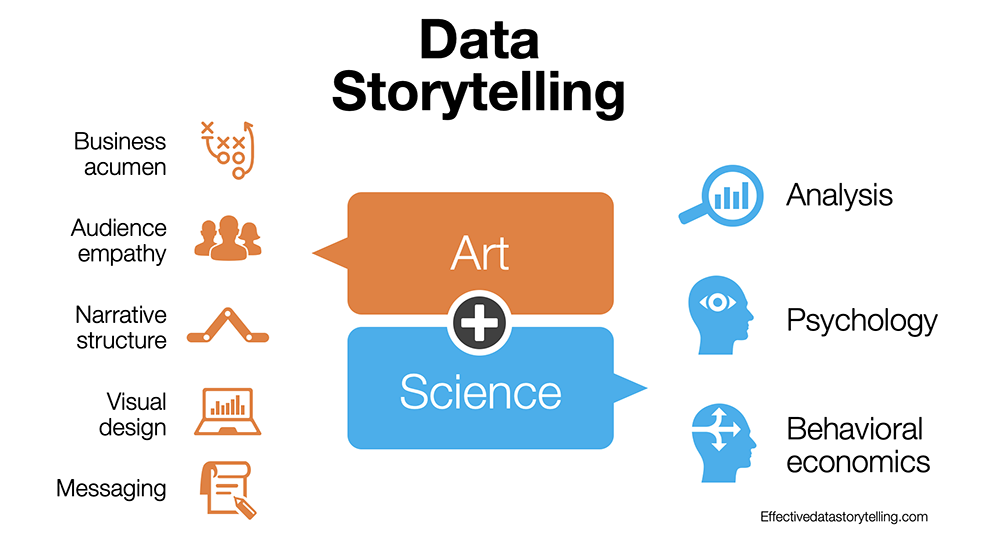
Data storytelling is the art of weaving a compelling narrative using intricate data and analytics to inform and persuade a specific audience. It merges the persuasive power of storytelling with the insights derived from data analysis to simplify complex information and facilitate quicker, more confident decision-making.
Here are the key points in detail:
Definition and Purpose: Data storytelling involves constructing a narrative around data and analytics to communicate insights effectively to a target audience. The purpose is to influence decisions, drive actions, and convey complex information in a clear and engaging manner.
Benefits:
- Value Addition: Data storytelling enhances the value of insights by presenting them in a narrative format that resonates with the audience.
- Simplification of Complex Information: It interprets intricate data, highlighting crucial points and trends for the audience to understand easily.
- Humanization of Data: By crafting a story around data, it adds a human touch, making it more relatable and memorable.
- Audience Engagement: Effective data storytelling captivates the audience’s attention and fosters meaningful interactions with the data.
- Influencing Decision-Making: By presenting data in a compelling narrative, it can influence people to make informed decisions and take specific actions.
Steps in Constructing a Data Story:
- Hypothesis Confirmation: Analyze all available data to validate or challenge a hypothesis.
- Data Collection: Gather relevant data sets and sources to develop the story.
- Defining Purpose: Clearly articulate the goal of the story and the intended audience.
- Story Outline: Structure the narrative from introduction to conclusion, incorporating key insights and supporting evidence.
- Critical Analysis: Evaluate the data objectively, considering both supporting and contradictory evidence.
- Audience Engagement: Determine the desired response or action from the audience after interacting with the data story.
Using Data Visualization to Enhance Storytelling: Data visualization plays a crucial role in data storytelling by transforming complex data into visually appealing and easy-to-understand graphics. Visuals such as charts, graphs, and infographics help illustrate trends, patterns, and relationships within the data, enhancing audience comprehension and retention.
Utilizing Data Dashboards: Data dashboards are powerful tools for presenting visualizations and insights in a consolidated and interactive format. They provide a comprehensive view of key metrics, trends, and performance indicators, enabling users to explore data dynamically and gain actionable insights in real time.
Key Elements of Data Storytelling:
- Narrative: Craft a compelling story around the data to provide context, relevance, and emotional resonance.
- Visuals: Use visual elements to support the narrative, enhance understanding, and engage the audience.
- Data Support: Ground the narrative in robust data and analytics, ensuring credibility, accuracy, and relevance.
By integrating these elements effectively, data storytelling can inspire action, drive change, and empower individuals and organizations to make informed decisions based on data-driven insights.


